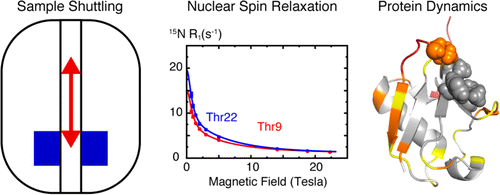
Field-cycling NMR has a wide range of applications in relaxometry, with protein studies requiring high resolution and sensitivity. In order to meet the demands of biomolecular systems, which exhibit a range of relaxation parameters, as well as the need for high resolution, a rapid field switch is essential. Recently, high-field static NMR has proven insufficient for studying biological systems, particularly in investigating protein dynamics. The field-dependent term in relaxation rate is crucial for extracting parameters related to molecular motions and understanding the spectra density function of protein dynamics in various biological systems [A. Refield, Journal of Biomolecular NMR 52(2):159-77]. Additionally, field-dependent longitudinal relaxation plays a vital role in fundamental physics studies of protein dynamics. Field-cycling NMR has also been employed in ligand-based 19F-NMR rescreening, which offers an efficient method for ligand binding. By utilizing the dynamics properties of ligands, 19F longitudinal relaxation in different magnetic fields enables fragment-based screening [C. Dalvit and M. Piotto, Magnetic Resonance in Chemistry 55(2) (2016), DOI: 10.1002/mrc.4500].
The High-Field Field-Cycler (HFFC) has demonstrated sensitivity and stability, making it suitable for protein dynamics investigations in various laboratories. Its sensitivity has been confirmed and published in the Journal of Biomolecular NMR (2016). The HFFC system has been successfully integrated into several commercial spectrometers equipped with different probe systems, including a 5mm cryo-probe system.
To illustrate the capabilities of field-cycling NMR, an example is shown with a 15N-1H HSQC 700 MHz spectrum (a) acquired from R1 measurements of a 500 μM 15N-ubiquitin sample. The spectrum was acquired in 20 minutes with field cycling from 16.5 T to 1.0 T and a relaxation delay time of 48 ms using a 5 mm TCI Bruker cryoprobe. The dashed square highlights the sensitivity enhancement achieved by utilizing a higher field spectrometer and cryo-probe system. Additionally, (b) displays 1H slices at 121.3 ppm 15N chemical shift corresponding to the long dashed rectangle area in the previous 2D spectrum. The red slice represents data extracted from a 1.0 T R1 measurement acquired at 600 MHz, while the black slice is from the same shuttling experiment at 700 MHz.

Chou, CY., Chu, M., Chang, CF. et al. J Biomol NMR (2016) 66: 187. doi:10.1007/s10858-016-0066-5
